Youtube Trends Case Study
I have been teaching myself data science and machine learning lately using MOOCs on Coursera and Udemy. And I am perpetually watching YouTube videos! So I decided to acquire data about YouTube videos and run my newly learned DS and ML agorithms to derive insights from that data. My goal is to analyze and sort channels based on their views, trending videos, likes, and dislikes. I also wish to research factors that effect the popularity of a YouTube Video. I retrieved this data from Kaggle. Kaggle is a really good resource to get authentic data sets to play around and practice with. I did some data preparation and cleaning prior to making insights to get rid of lengthy description column, skewed rows, and insufficient or incompete rows.
Data Preparation and Cleaning
Before I could connect the data to tableau or upload the csv files into MATLAB or Pandas I decided to clean the data. I noticed there were a lot of uneven or empty rows. I also noticed how the description was way too long and didn’t contain information that I could use for the kind of insights I wanted to draw. I decided to delete the description column and upload the the data in SSIS to practice and perform
Extraction, Transformation, and Load(ETL)
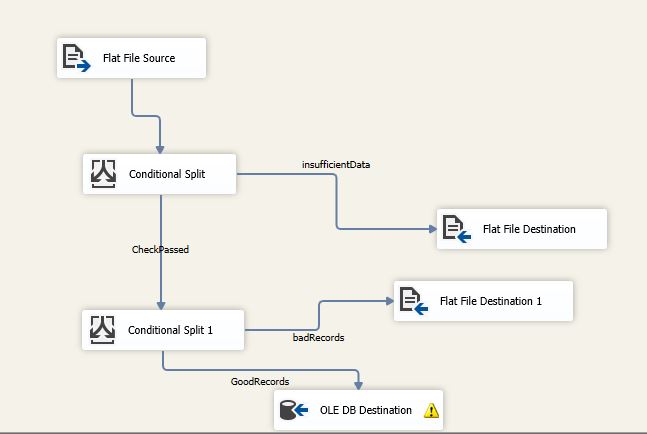
Following is a screenshot describing the process.
I used the first conditional split to get rid of the extra rows that don’t have sufficient information in the columns that I would need for getting my desired insights. I did this by using a boolean condition checking for empty columns. This got rid of 3323 rows. All of these were just leftover truncated data from that messy description column I manually removed. I then checked for skewed data to see what caused empty columns 15-26 by changing non empty columns. This got rid of 6 identical rows. The leftover data was send to an OLE DB destination hence producing a Raw Data Table of records in SQL
ETLT
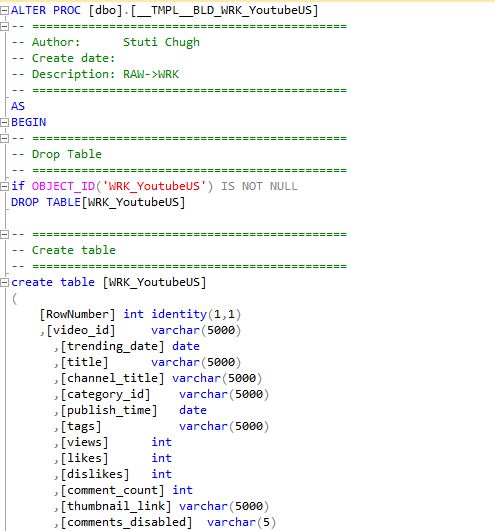
The data cleaning and preparation didn’t end here. My Udemy instructor Kirill Eremenko mentioned how ETL process often becomes TETL or TETLT instead of just ETL because we continue to prep and transfer data to get the most robust model. Before turning RAW Table into a WORK Table I check if empty Columns 15 through 26 were indeed empty and conditional split was indeed successful in removing all the skewed unecessary description. Turns out columns 15-26 are empty in the filtered out data so they were safe to discard without losing any rows. So now I proceeded towards making a WRK table using Procedures in SQL as follows:
A stored procedure lets us create a WORK table using the RAW table. Upon executing this command I got the following error.
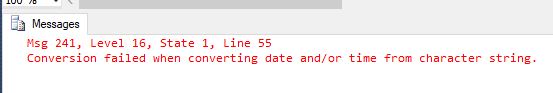
Stored procedure was fully relying on implicit conversion by SQL but this error shows that there might just be some more anomalies in our data that we need to get rid of. Since it wasn’t able to convert string to date. This tells me that there is a possibility that there is a record that still has some text instead of publish or trending date. Here is how I checked further.
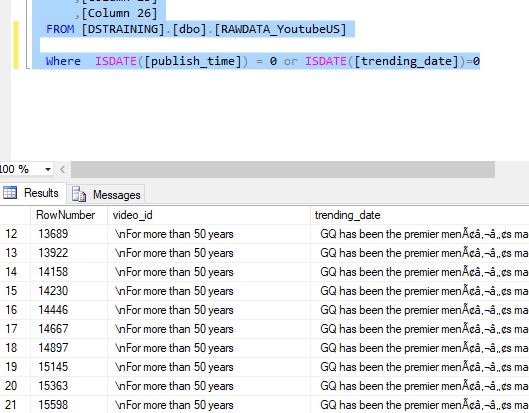
This command returned all the records that have texts in the dates columns> next thing, I deleted all of these records because trending date and publish date are crucial to my research and any records that don’t have that information won’t be of any use to me.
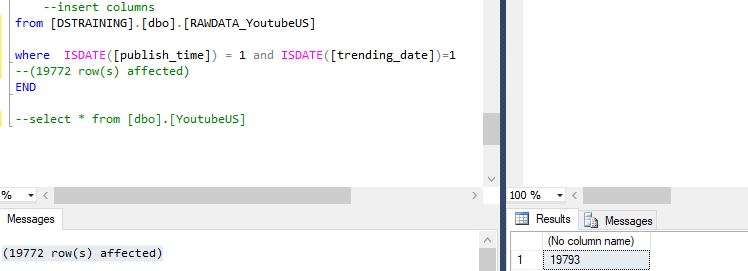
This command removed all those records and I now had 19772. Before excluding these rows the data 19793 rows. So 21 records were removed. I did some additional checks to thoroughly check my data. They didn’t return any anamolous rows but it’s always good to do extra checks.
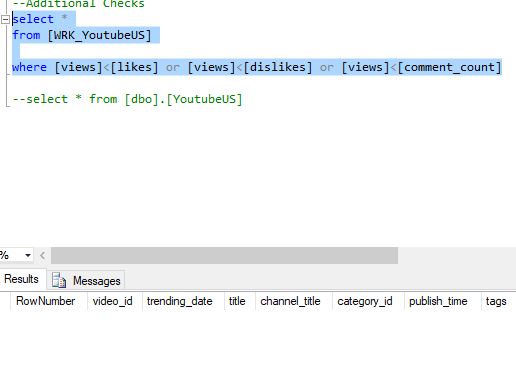
Some times number of views is less than total likes and everyone is leaving comments like- “YouTube you’se drunk” or “YouTube be Trippin’” and I wanted to check for that lol.
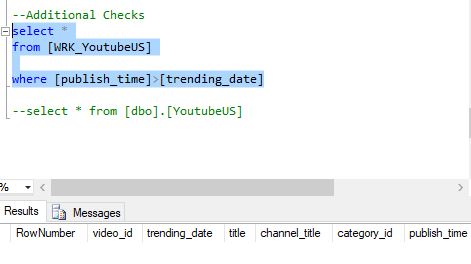
I checked to make sure there is no data where the publish date is after trending date because that would have been an error or anomaly I wouldn’t want to include in my study. Fortunately all of my additional checks failed and didn’t return any rows. At this point I felt my data was clean and I could proceed towards drawing insights from my data.
Data exploration, modelling, insights
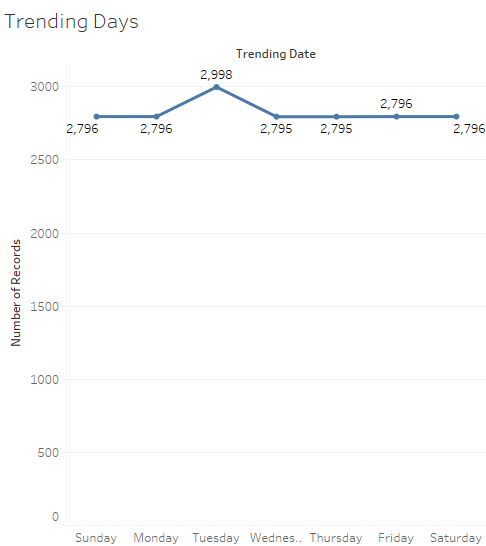
Trending and Uploading Days: I have heard from a lot of social media enthusiasts like myself that there is a certain time in the day when one tends to get more likes and views. Some of my friends say weekday after 5 or during lunch are good times to change your Facebook profile picture because apparently that’s prime browsing time. Some say Saturday morning is a good time to grab likes and comments on an Instagram! I always wondered if these rules apply to YouTube videos as well. So distributed the publish time along days of the week and foundthe following information.
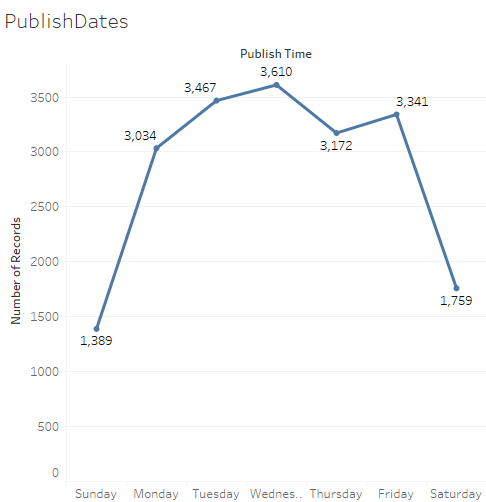
So it looks like people tend to upload the most on Wednesdays. And since this is a data full of all videos that have trended at some point I am guessing they are on to something with this. I could see how people would want spend most time on YouTube on humpday.And it makes so much why most of my favorite YouTubers tend to post new videos on Wedensdays. I also ran a similar test on trending dates and that data wasn’t ver interesting or insightful to me. All it said was videos usually tend to trend on Tuesdays. I guess that’s when YouTube decides to update their Trending page maybe, who knows? Here is the data I got.
Popular Channels and My Favorite Channels
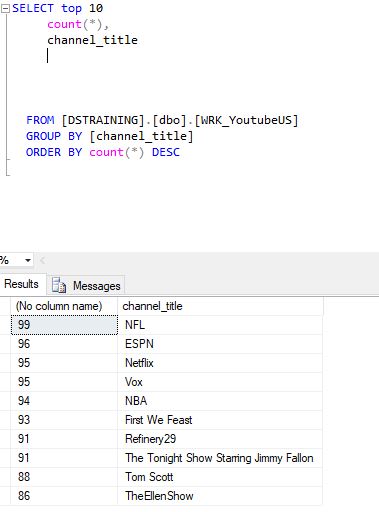
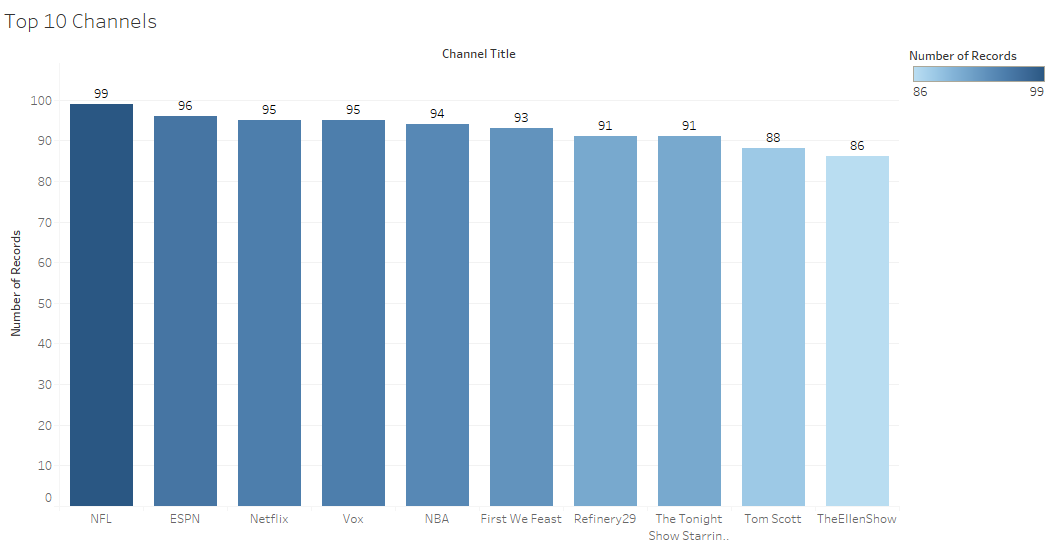
Another most common analysis that one tends to ponder about such data is how many channels have the most Trending videos. To my surprise(or oblivion) sports channels had the most Trending videos. Since I mostly watch comedy channels or sketch content creators this was interesting to me. Though all the funny late night videos were a close second. I used the following SQL query to get that data and then used Tableau to plot it.
My next genuine curiosity went in the direction of my favorite youtubers and getting stats about them. So I did exactly that. I filtered out my favorite channels and checked how often in the time span in which this database ranges have my favorite youtubers had trended videos. Here’s the result of that query and some interesting insights I drew from it.
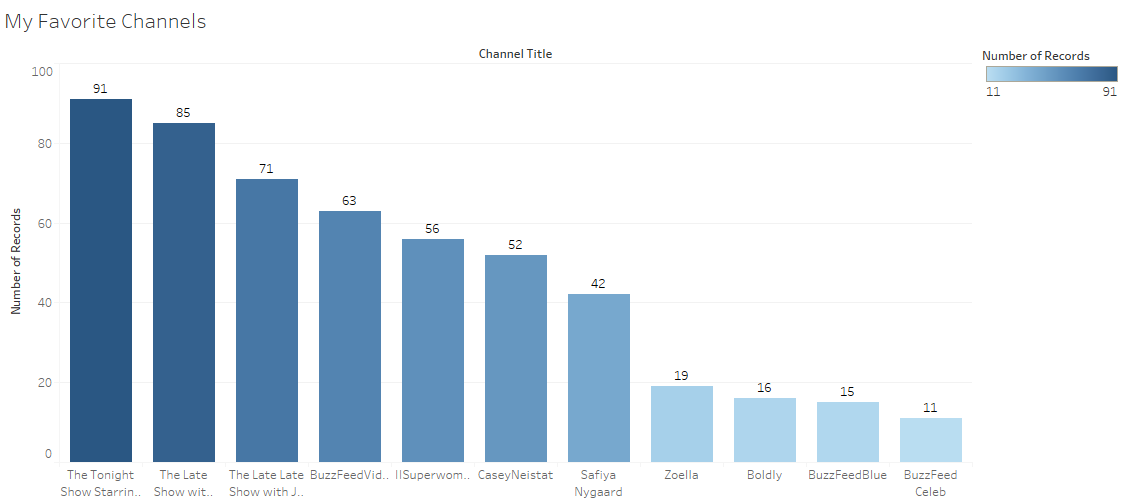
It was interesting to see that Superwoman has more views than Casey Niestat! You go girl!#GirlLove. I was also really happy to see my girl Saf had more trending videos than her former place of work-Buzzfeed. Safiya Nygaard started a YouTube Channel less than a year ago and she already has 4 Million subscribers! And she used to work at Buzzfeed before starting her own channel.
Another interesting thing was that conventionally famous TV shows and channels like Jimmy Fallon, James Corden, and Stephen Colbert still took a lead over self starters like Superwoman and Casey. Nevertheless its very impressive that these self-made YouTubers are very close to these bigger channels. The Buzzfeed media company is a close second and getting most trending videos after conventional TV shows.
Total Views v/s Total Trending Videos
The above observations got me thinking if number of trending videos is a good metric of YouTube Succcess. I have also wondered if there is an correlation between videos of the trending page and the number of views those trending videos get. So I decided to compare the total number of views a channel gets to total number of trending videos. I used the following SQL commands.
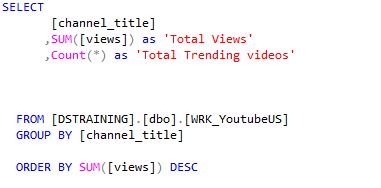
Firstly, I plotted the number of views and trending videos of the top 10 channels ranked by total views.
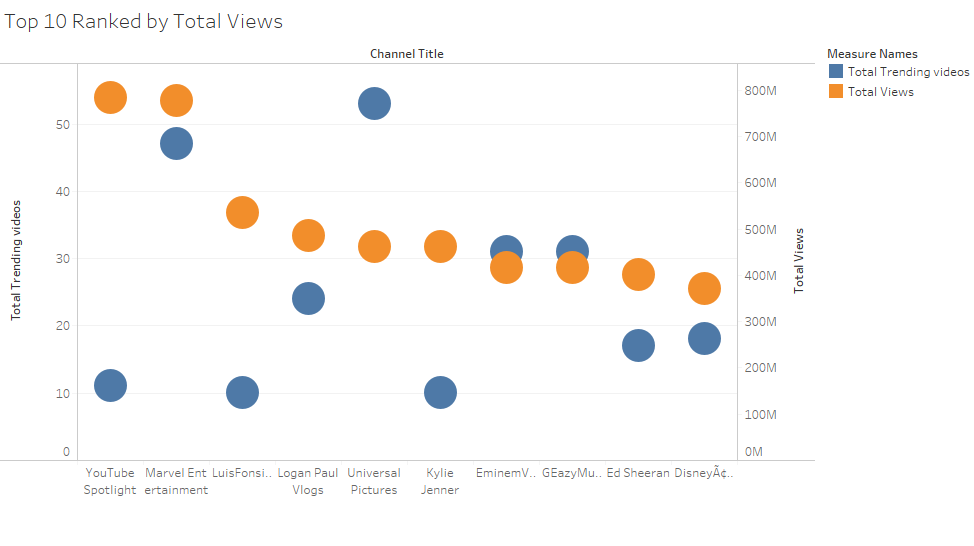
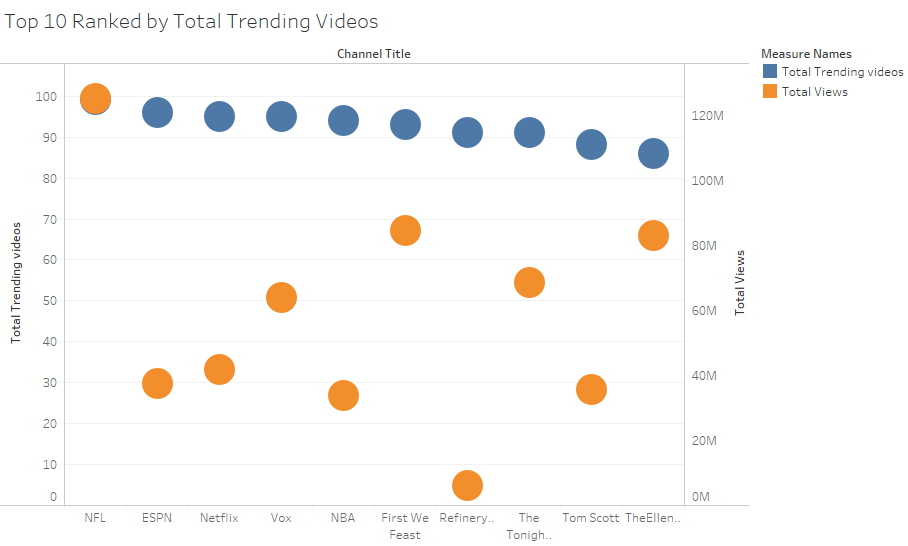
So as I suspected, being trending doesn’t necessarily coincide with getting the most views. As this dual axis graph shows EminemVEVO and GEasy channels are the only ones that show are an overlap. The notorious Logan Paul ranks 4th in the total views epartment but he isn’t in the top 10 when channels are ranked by total trending videos as follows:
Like to Dislike Ratio v/s Popularity
This analysis further got me thinking if hate gets you more views. So I decided to do a sum of likes to sum of dislikes ratio and compare it to total views. While I was in the process of doing this I encountered a division by zero error. This further got me thinking if I should exclude the videos with zero dislikes. But any videos with zero dislikes might not just have all likes. Maybe comments and ratings are disabled over all.
This would have further confirmed my conjecture that scandal and being disliked earns you more views. So first I decided to look at the count of channels that actually, genuinely have no dislikes.
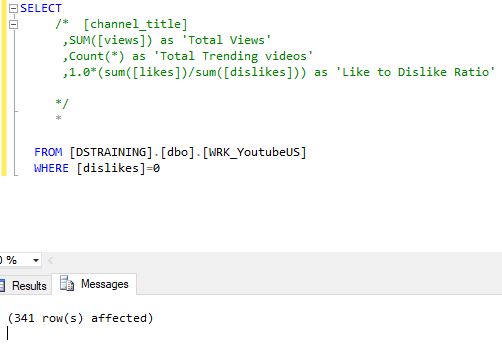
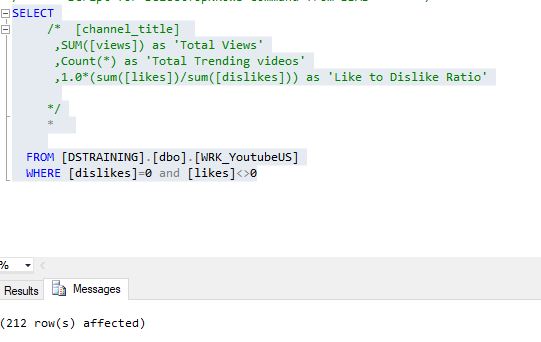
So turns out there are some genuinely not disliked channels, 341-212=129 to be precise. But these channels were not ver famous either.
I still wanted to establish a LD(like-to-dislike) ratio and do some research with it. So I decided to just put null for the columns where the denominator(sum of dislikes)=0. I ran the tests and found the following:
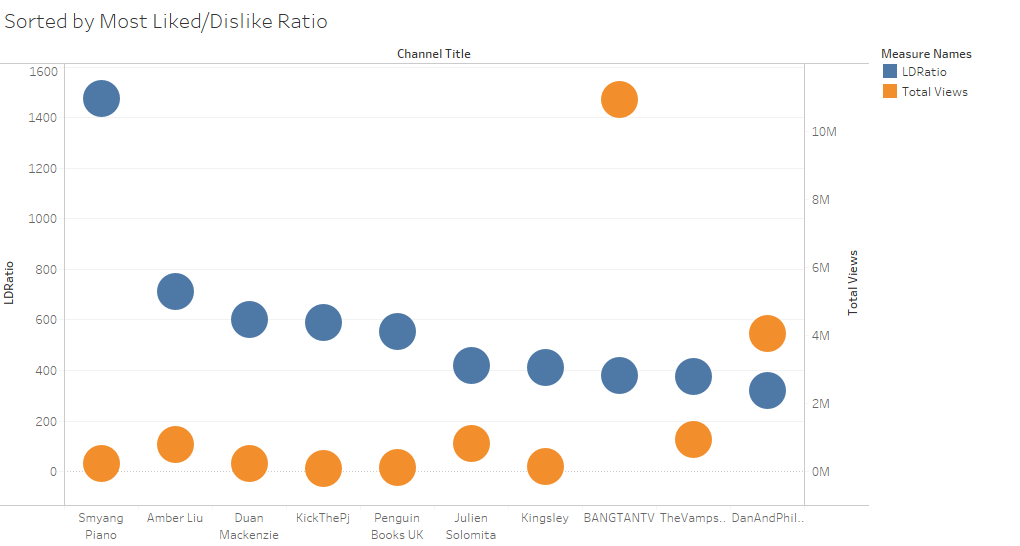
There are a lot of channels with very high LD ratio(i.e. way more likes than dislikes) but less than million views. For example Kingsley and DanAndPhil don’t necessarily have viral video level views but are in the top ten in LD ratio.
Now Let’s look at the same graph but this time ranked by views.
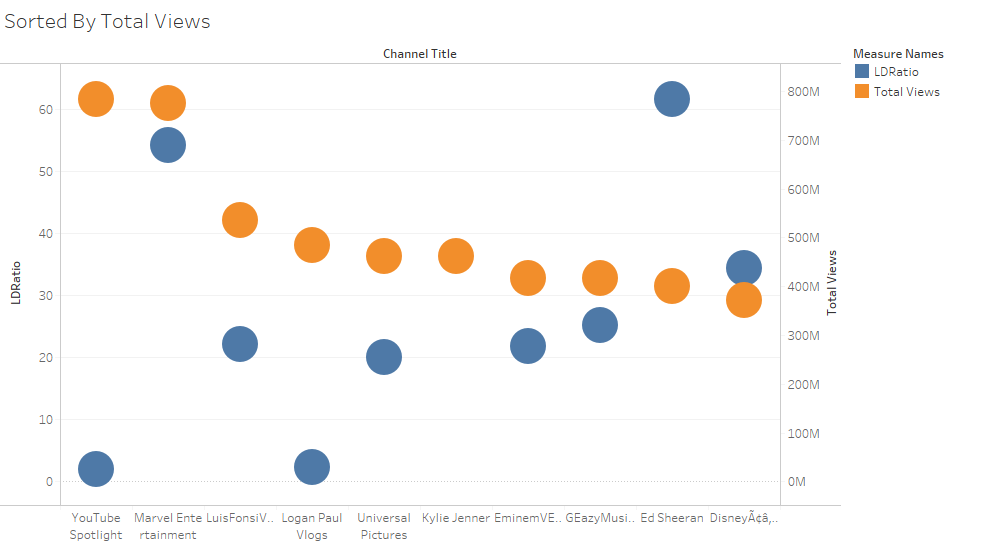
Notice how channels that have a single digit LD ratio are like YouTube Spotlight or Logan Paul have very high views. Another interesting observation is that Kylie Jenner doesn’t have a blue dot because she has her comments and rating disabled yet she made it in the top 10 Ranked by Views graph.
Multiple Linear Regression
My next task is going to be running a multiple linear regression algorithm to see the factors that effect the popularity of a video. I will be analzing video title, video category, tags, and channel name as my regressors and views as the the dependent variable.
Stay tuned for my insights and results.